I currently work as a research analyst in the Doan Lab at the The Francis I. Proctor Foundation for Research in Ophthalmology, University of California, San Francisco.
The information below is a bit dated by now, and refers to various research project I have worked on in the past. My past research often tackled the question how animals respond to cues from their environment and how they use this information to successfully navigate through space. Answering these questions necessitated the construction of various scientific apparatus that allowed me to measure neural and behavioral outputs to various challenges presented to an animal. This page focuses on the hardware part of these projects.
Please see my list of publications for more details and more current research.
Example projects, with a focus on the exerimental apparatus
- Dilution flow olfactometer: cockroach odor perception
- Double-beam differential interferometer: physics of auditory hair cells
- Moth virtual-reality arena: hawkmoth flight control
- Moth flight chamber: free-flight stimulation of antennal muscles
- Moth flight chamber odor mixer: effect of background odors on target odor perception
1) Undergraduate (Magister rer. nat.) project (University of Vienna, Tichy Lab)
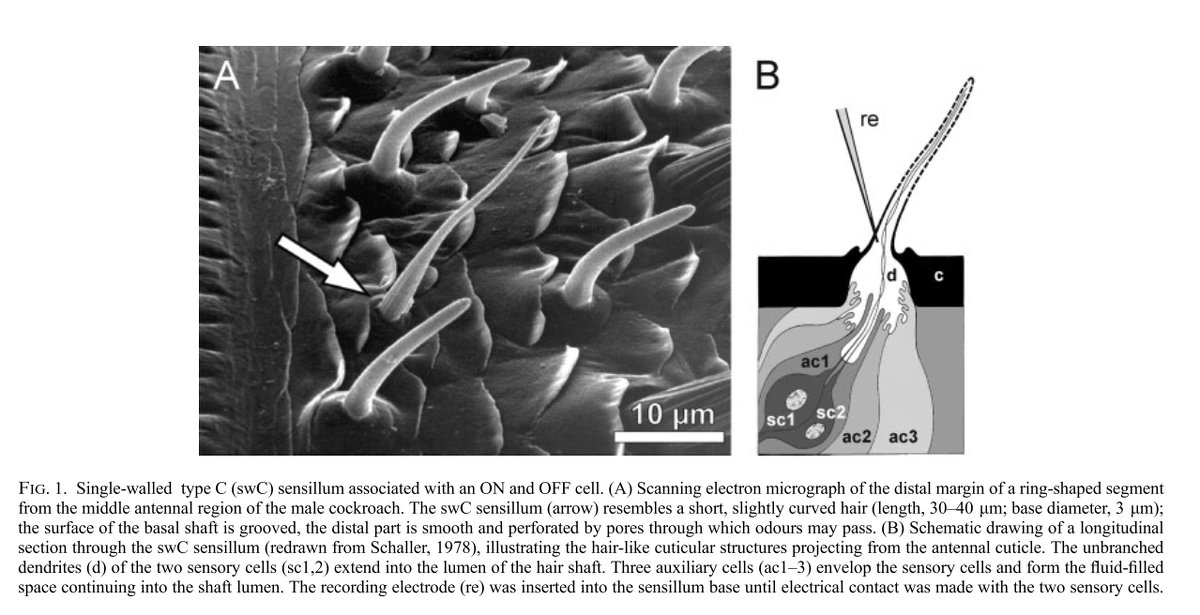
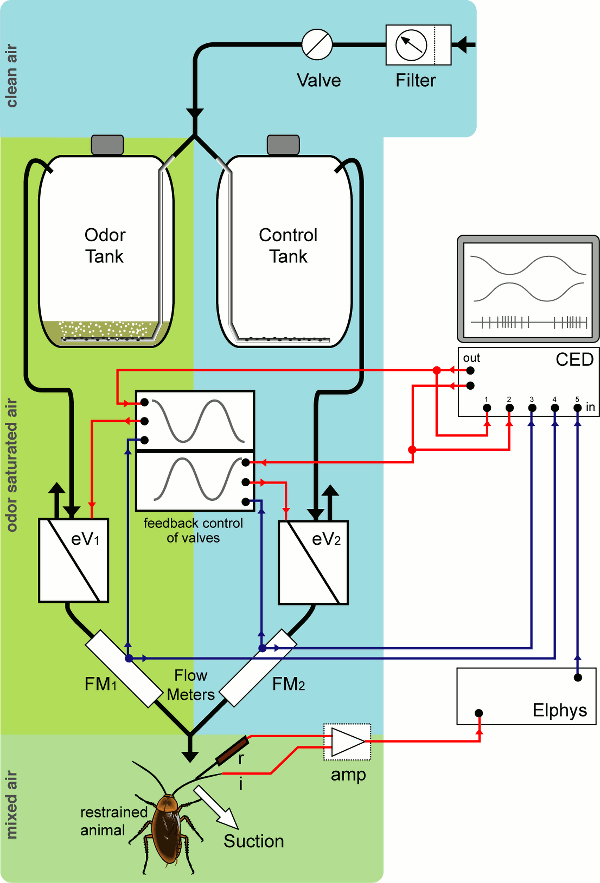
Question: How do insect sensors perceive slow-moving odor plumes?
I built a dilution flow olfactometer, which allowed the presentation of a laminar flow of air onto olfactory sensilla of a cockroach antenna. The concentration of a food odor in this air flow could be smoothly and slowly regulated between (almost) zero odor to odor-saturated. By looking at the response of sensory neurons contained at the base of each sensillum, I showed that these sensilla can not only distinguish between different rates of change of odor concentration, but also respond to changes in an antagonistic, edge-enhancing fashion: one sensory cell signals an increase in odor concentration with an increase in firing, the other one (in the same sensillum) with a decrease in firing.
2) Research assistant (The Rockefeller University, Hudspeth Lab)
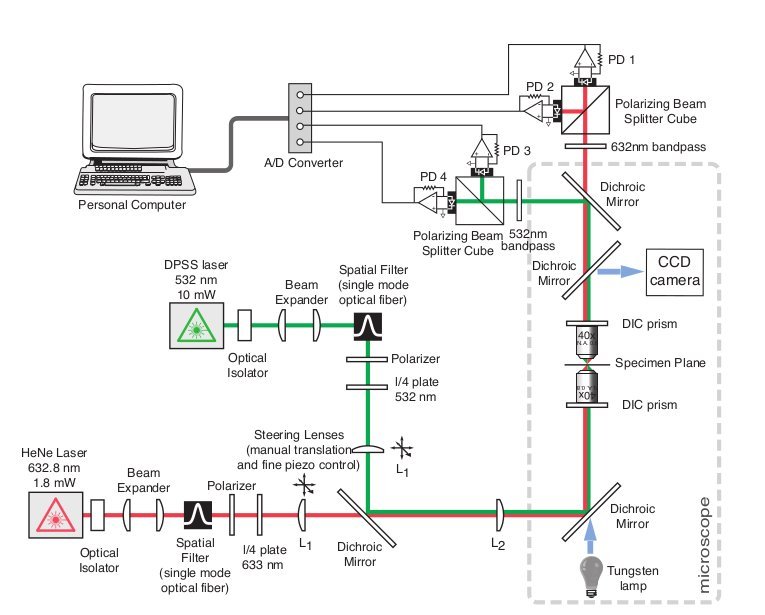
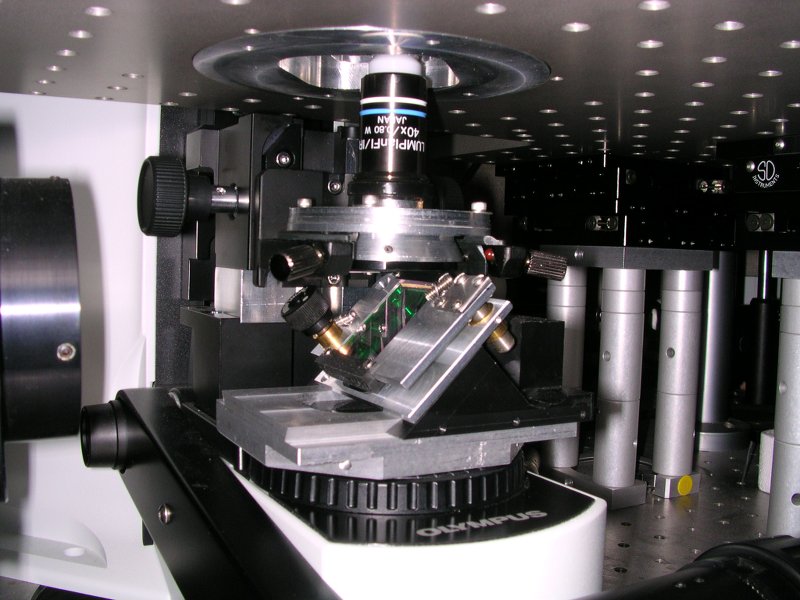
Hair bundle physics
After I received my Magister degree from the University of Vienna, I had the good fortune to work in the Hudspeth lab at the Rockefeller University in NYC. While there, I helped in the construction of a dual-beam interferometer sensitive enough to measure the differential motion of stereocilia on opposing ends of an auditory hair cell. I researched components and design ideas, built custum parts to modify a conventional upright microscope, and helped in calibration and experimental procedures.
3) Ph.D. project (University of Washington, Daniel Lab)
Moth flight control experiments in a virtual reality arena
For my PhD research in the fun-tastically fabulous Daniel Lab at the University of Washington, I built a flight arena for the large hawkmoth Manduca sexta, in which I could test how mechanosensory and visual inputs are integrated to provide a moth with a reliable flight control system. The setup is very much inspired by the Rock'n'Roll arena in Michael Dickinson's lab. See the embedded video below for an animated schematic of what a moth experiences during an experiment.
Moths show very strong abdominal flexion responses that are elicited both by pure visual, as well as pure mechanical rotations. My 2010 publication (Hinterwirth and Daniel, 2010) describes how the insect's antennae mediate a flexion response of the abdomen when a moth is rotated in space mechanically. This movement of the abdomen (by changing the center of mass with respect to the center of lift) could be used as a brake for rotations of the animal in the pitch axis.
The following video shows how the abdominal angle changes when the moth is watching a periodic, oscillating grating.
Multisensory integration happens at many levels
Animal sensors are often influenced by each other. I have recently started exploring how visual motion might affect mechanosensory organs situated at the base of a moth's antennae. In the next video below, an isolated head of a moth is placed in a visual arena and presented with an oscillating grating. At the same time, I'm recording EMG signals from a tiny muscle at the base of an antenna. As you can see in the evolving traces shown in the video (and hear in the audio), the muscle firing rate is clearly modulated by the up-and-down movement of the pattern. This shows that circuits contained within the head are able to modulate antennal muscle firing, and by extension, antennal position.
The effect of a visual stimulus on antennal position can be more directly visualized by just filming a moth's head from the side with a high-speed video camera. Below is a sample video, in which the moth's head is fixed, and it is forced to watch a strong visual stimulus oscillating around it's pitch axis.
Notice how the antennae move up and down with the same frequency as the visual stimulus. This can be quantified by measuring the antennal angle for each frame and plotting it against the stimulus, as shown in the lower traces in this video. (The visual stimulus is stronger than in the example above, so it's easier to see the antennal movement. It also means the legs of the moth react when the moth "thinks" it's falling, i.e. when the visual stimulus moves upwards.)
Free-flight stimulation experiments in a wind tunnel for insects
After finding that the base of a moth's antennae has sensors that can influence flight, it made me wonder what happens if you jiggle an antenna in free flight. Doing so mechanically is hard, because it's difficult for a moth to carry a mechanical stimulator. As an alternative, I proposed hooking up electrodes to the muscles responsible for positioning the antennae. Sending brief electric pulses to these muscles makes them contract, thus leading to a stimulation of the basal mechanoreceptors. For this and other free-flight experiments, I designed and built a large wind tunnel that allowed filming the animals in free upwind flight. See this post for more detailed information and pictures of the flight chamber.
I also created an Arduino-based camera trigger, which makes sure a high-speed video gets captured whenever a moth flies through a pre-determinged volume of space. Please find more details about the laser camera trigger in this separate post.
Using a very light weight stimulator board (“RadioFlyer”, developed in collaboration with MIT) that could be remote-controlled, I repeatetly elicited antennal muscle contraction in free flying moths. The pitch axis is the only one that robustly responds to such stimulation.
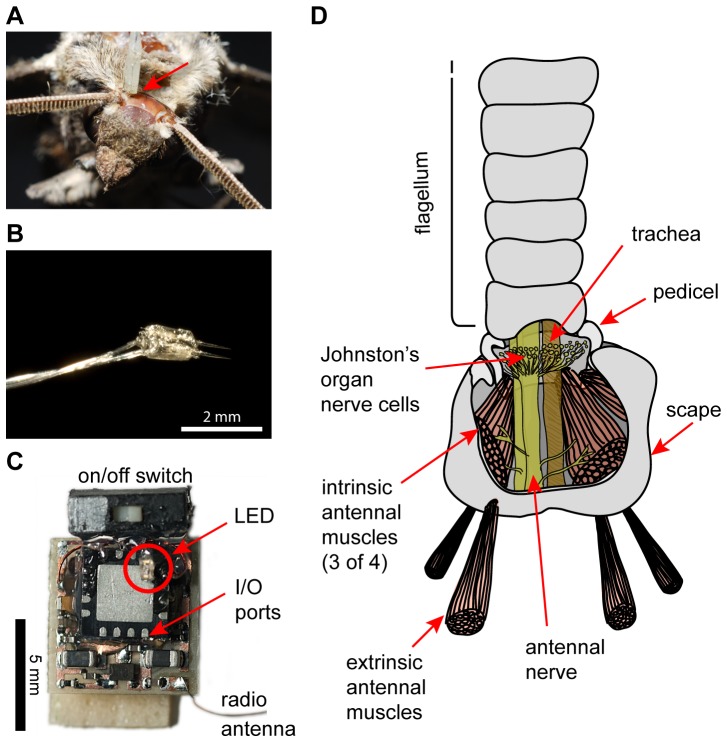
Overview of how antennal stimulation in free-flying animals was achieved.
(A) Top view of a moth's head, with one electrode pair placed (indicated by red arrow), but not yet waxed down, to target extrinsic antennal muscles. The other electrode pair has not yet been placed. (B) Photograph of a typical pair of tungsten electrodes used for electrical stimulation of extrinsic muscles. (C) Photograph of the “RadioFlyer” microcircuit that is mounted ventrally on a moth to provide telemetrically triggered electric muscle stimulation. (D) Simplified schematic (redrawn and modified from [10]) showing the two muscle groups involved in positioning a moth's antennae. Extrinsic muscles, which move the whole antenna with respect to the head, were targeted for the experiments presented here.
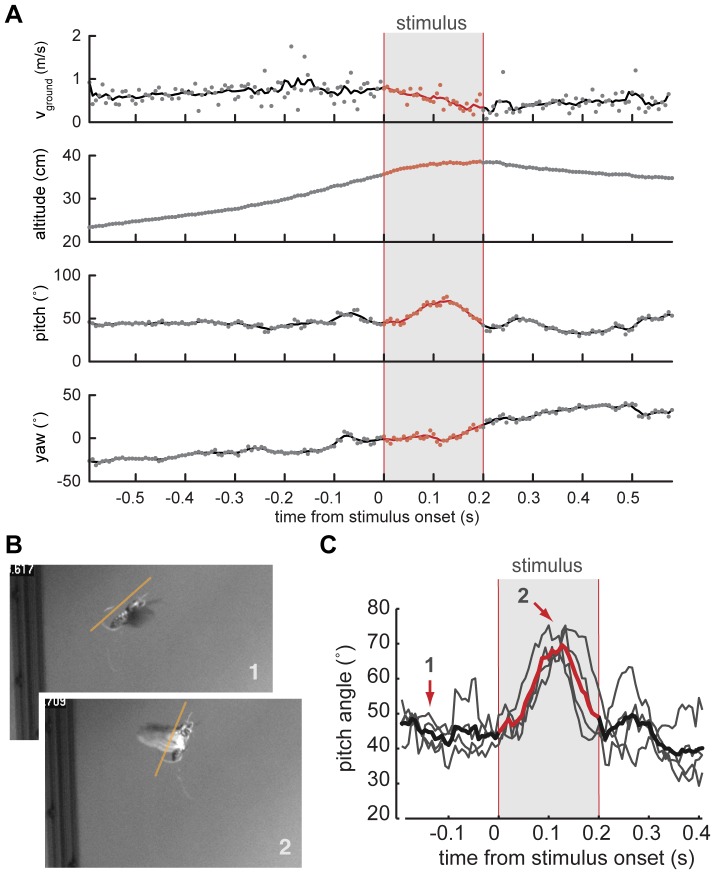
Analysis of changes in flight trajectory elicited by in-flight stimulation of antennal muscles.
(A) Ground speed (vground), altitude, as well as pitch and yaw heading of a moth's body vector calculated from a 3D reconstruction of a free-flight trial during which extrinsic muscles of the left antenna were stimulated electrically. Stimulus timing is indicated by the gray bar. The change in pitch angle is the only parameter change that could be elicited repeatedly and in a similar fashion in multiple animals. Changes in ground speed, altitude and yaw heading are unique to a specific trial. (B) Still images of a moth outfitted with an on-board stimulator shortly before (1), and during the stimulus (2). (C) Average change in pitch angle (red line) for 4 successive trials (underlying grey lines) in one animal shows a consistent response to stimulation. The arrows indicate time points corresponding to the still images in B.
4) PostDoc at UW (Daniel Lab)
Odor mixer module for the wind tunnel
Jeff Riffell at the University of Washington is a leading authority in helping our understanding of how insects move up an odor plume. I was lucky to be part of his research project that investigated how background odors influence an animal's ability to find (and perceive) a target flower odor. I added a computer-controlled, solenoid-based odor delivery system to the wind tunnel: a single port for flower odor, and a large odor mixer array for introducing background odors. The following figure from the Materials and Methods section of the paper (Riffell et al, 2014) shows some details:
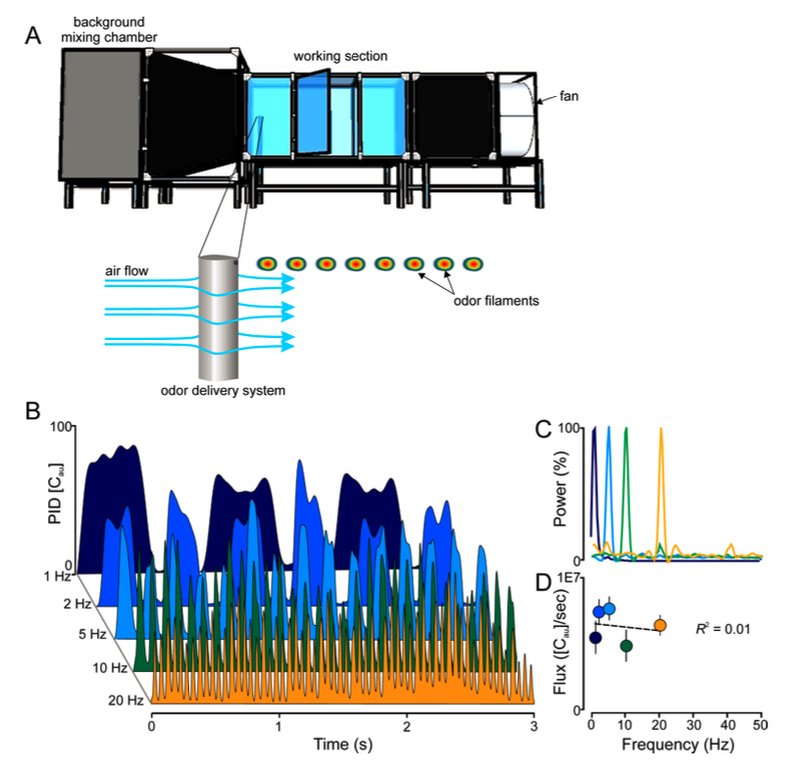
Fig. S1. (A) Experiments were performed in a 2.5×1.0×1.0 m3 wind tunnel (A, top), equipped with a camera-based 3D tracking system to observe moths as they navigate to the pulsed plume. Odors were delivered isokinetically by a computer-controlled solenoid system that emitted the odors from an airfoil that minimized disturbance to the flow of air (0.5 m/sec. wind) (A, bottom). (B) Time series of odor pulses (1 to 20 Hz) as measured by a photoionization detector (200B miniPID; Aurora Scientific, Aurora, Ontario CA). (C) Frequency spectrum of concentration changes at four different pulse frequencies: 1, 5, 10 and 20 Hz. Each trace is the mean of three, 2-min, recordings at 300 Hz. (D) Flux, or concentration of odor molecules (as measure by PID [Cau]) per sec. ([Cau]/s), for each frequency. The flux at each frequency was not significantly different (one-way ANOVA: F4,15 = 2.19, P = 0.14); this was also reflected in the linear regression (R2 = 0.01; F1,15 = 0.20, P = 0.65). Symbols are the Mean ± SEM; the dashed line is the linear regression.